This post makes the argument using . . .

. . . from Social Security to show that the GOP's newly proposed tax plan will not save the "middle-class" very much money (but will save the rich VERY MUCH by eliminating the estate tax and save big corporations and hedge funds VERY MUCH by lowering the corporate tax from 35% to 20%).
And this post also shows that the Republicans and Democrats have NO CLUE AT ALL (either that, or they have been lying to us all along) what the middle-class really is or where it's supposed to be today.
You don't have to believe the recent article in the New York Times, — or what Fox News, CNN, the Republicans or the Democrats have to say about whether or not you'll get a tax cut under the GOP's new tax plan. Just compare the income brackets and the tax rates they propose (and also to see WHO'S getting the BIGGEST tax cuts) by comparing the current tax brackets to the proposed tax brackets (chart directly below). Then look at wage data from the Social Security Administration (which is also in the info-graphic below that) to see where your income falls in the big scheme of things (and also to see where the TRUE "middle-class" currently stands).
* NOTE: The Senate's new version NOW includes the income levels (per CNN). In this version, those earning between $60,000 and $91,900 will see no change (at 25%), but like everyone else, will get an addition $1,600 in standard deduction. (Current tax deduction: $10,400 = $6,350 standard deduction + $4,050 personal exemption. Tax deduction under new plan: $12,000 = $12,000 standard deduction but no $4,050 personal exemption ... which is $1,600 more.)

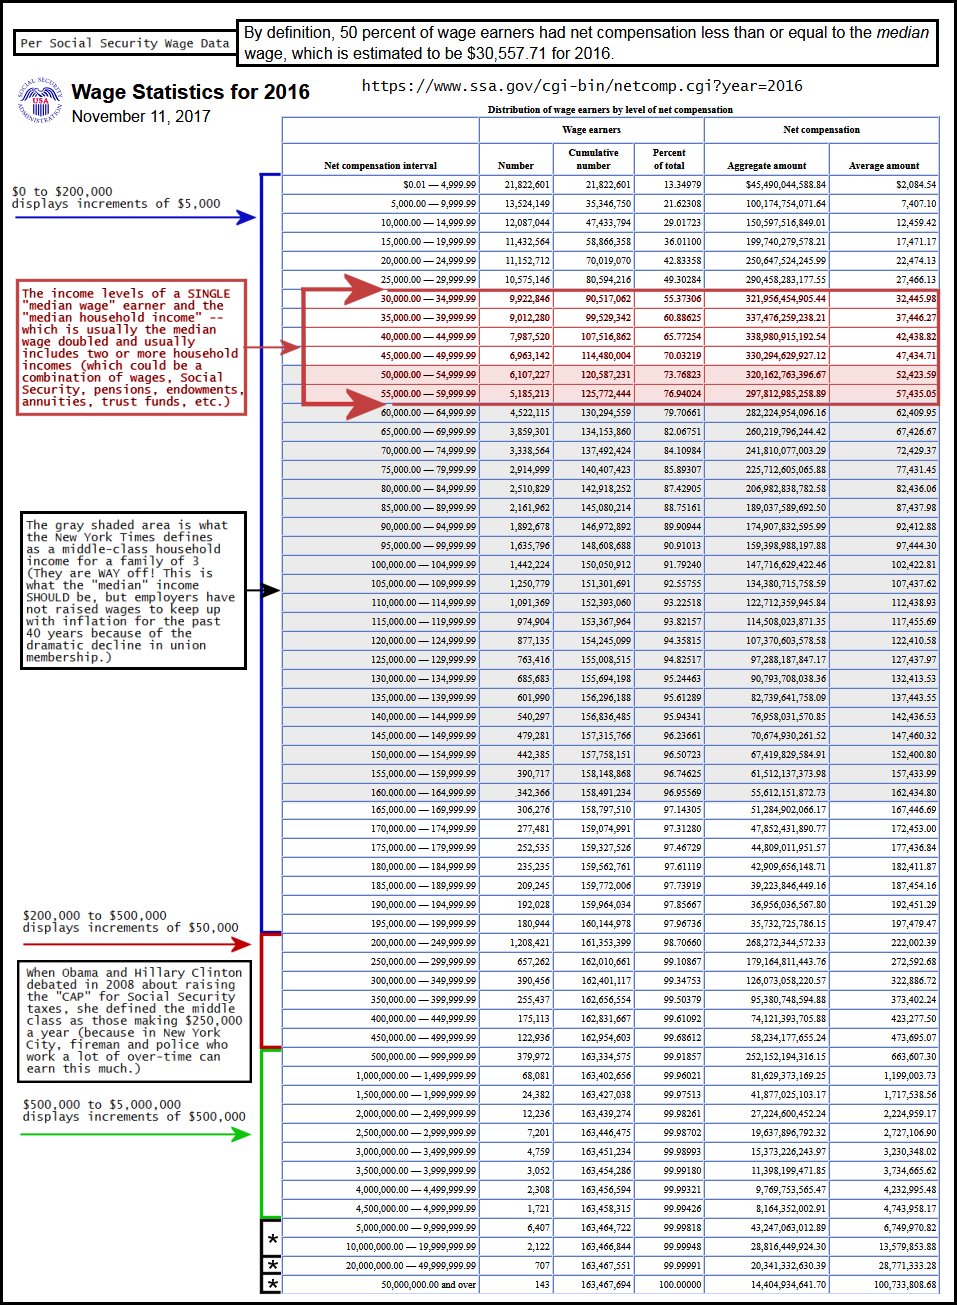
* Click on the info-graphic that I created below to enlarge to see important notes I've made regarding the wage data from Social Security and how it defines the TRUE middle-class.
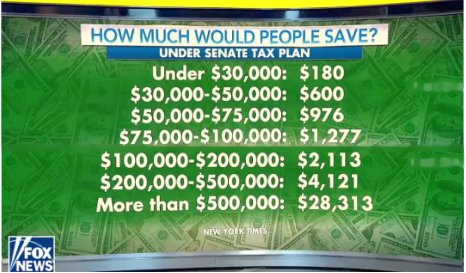
Below in an info-graphic from Fox and Friends (on Fox News) this morning using data from that New York Times article to show how much people will save with the GOP Senate version of their tax plan (for the poor, not much . . . but a lot for the rich.)
Below is a graph from the St. Louis Federal Reserve for the MEDIAN WEEKLY WAGE (for a full-time worker), which hasn't budged for almost 40 years. The REAL weekly wage after taxes and accounting for inflation is $385 a week. (Because of the drastic decline in unions since that time, workers no longer have bargaining power to demand raises, so most of the profits now go to the CEOs, board of directors and the shareholders.)
* MEDIAN wage means 50% of wage earners make LESS than the MEDIAN (the exact middle) and 50% of wage earners make MORE than that.
* NOTE: One person making ONE MILLION DOLLARS A YEAR skews the "average" and makes it appear as though most people are making more, so we use the "median" wage, not the "average" wage.

The Estate Tax is NOT a "death tax" - - - it's just a slogan to fool average Americans to accept a windfall for rich people.

Who does the GOP think they're fooling? We're on to them. Both Republicans and Democrats know a con/scam when they see one. Republicans look like a bunch fools on TV trying to sell us this pile of crap. Snake oil salesmen are much more convincing than Paul RYan & Co. - - - so it's no wonder they can't pass any bills.

* All images are my creation except for the screen shots from Fox News and FRED — and the Social Security logo.
Happy Veterans Day! (Especially to my dad.)
* NOTE: I could have named this post GOP TAX PLAN vs GOP TAX SCAM

No comments:
Post a Comment