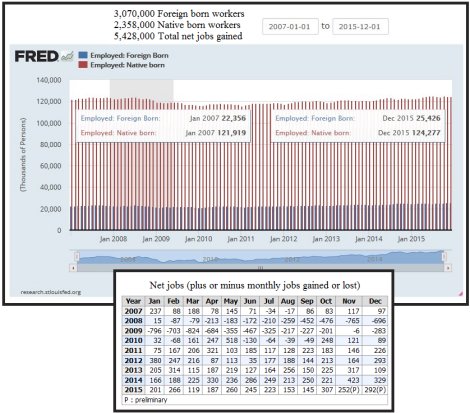
Job creation from January 2007 to December 2016
= 3,070,000 Foreign-born workers added / Source: St. Louis Federal Reserve (FRED) Foreign born workers
+ 2,358,000 Native-born workers added / Source: St. Louis Federal Reserve (FRED): Native born workers
= 5,428,000 Total net jobs added to labor force over the past 9 years*
* The Bureau of Labor Statistics shows 6,031,000 net jobs were added to the labor force from January 2007 to December 2015 — for a difference of 603,000 more jobs than what FRED shows. (See the table further below.) According to FRED, the U.S. had 712,000 more foreign-born workers added to the labor force over the past 9 years than native-born workers. So even if the difference were added to native-born workers, foreign hires still exceeded native hires.
Click chart to enlarge

Monthly Jobs added to Labor Force
Source Bureau of Labor Statistics: Net jobs plus or minus in monthly
jobs gained
or lost (in thousands)
http://data.bls.gov/timeseries/CES0000000001?output_view=net_1mth
| Year | Jan | Feb | Mar | Apr | May | Jun | Jul | Aug | Sep | Oct | Nov | Dec | Annual Gain/Loss |
|---|---|---|---|---|---|---|---|---|---|---|---|---|---|
| 2007 | 237 | 88 | 188 | 78 | 145 | 71 | -34 | -17 | 86 | 83 | 117 | 97 | 1,139 |
| 2008 | 15 | -87 | -79 | -213 | -183 | -172 | -210 | -259 | -452 | -476 | -765 | -696 | -3,577 |
| 2009 | -796 | -703 | -824 | -684 | -355 | -467 | -325 | -217 | -227 | -201 | -6 | -283 | -5,088 |
| 2010 | 32 | -68 | 161 | 247 | 518 | -130 | -64 | -39 | -49 | 248 | 121 | 89 | 1,066 |
| 2011 | 75 | 167 | 206 | 321 | 103 | 185 | 117 | 128 | 223 | 183 | 146 | 226 | 2,080 |
| 2012 | 380 | 247 | 216 | 87 | 113 | 35 | 177 | 188 | 144 | 213 | 164 | 293 | 2,257 |
| 2013 | 205 | 314 | 115 | 187 | 219 | 127 | 164 | 256 | 150 | 225 | 317 | 109 | 2,388 |
| 2014 | 166 | 188 | 225 | 330 | 236 | 286 | 249 | 213 | 250 | 221 | 423 | 329 | 3,116 |
| 2015 | 201 | 266 | 119 | 187 | 260 | 245 | 223 | 153 | 145 | 307 | 252 | 292 | 2,650 |
= 6,031,000 total net jobs added to labor force from January 2007 to December 2015 (As was mentioned above.)
As an aside: According to the National Center for Education Statistics (NCES), during this time span, we've also averaged over 3 million high school grads each year — and/or college grads, because the majority of high school grads have gone on to college and graduated.
NOTE: For more on this subject, see Virgil's post at Keep America at work


Foreign students with temporary work permits get an extension. Those with degrees in the science, engineering, technology and mathematics, or STEM, fields can apply to work for up to 17 additional months.
ReplyDeletehttp://www.marketplace.org/2016/01/20/world/foreign-students-extended-visas-may-have-leave
Buried in the omnibus spending bill was an expansion in the H-2B visa program for less-skilled seasonal workers outside of agriculture. The changes will not increase the current H-2B visa cap, but instead will exclude from the cap workers who have received an H-2B visa in the last three years. As John Miano has pointed out, the provision could theoretically quadruple the number of visas for this year, to 264,000, though the actual increase is likely to be smaller.
http://cis.org/a/no-evidence-labor-shortage-h-2b-occupations
What is the difference between a robot displacing a domestic worker and a foreign "guestworker" displacing a domestic worker? Or by using the example of the "Mariel boatlift"? Or by offshoring jobs to China? Isn't the end result the same? Fewer jobs and lower wages?
ReplyDeleteDid you look at the states? I think you'll find the vast majority of immigrant work increase is in the usual handful of big states and is nothing new to those areas at all ever.
ReplyDeleteJMJ