Showing posts with label unemployment. Show all posts

Wednesday, May 2, 2012

Two Income Households, 'Mean' and 'Median' Income Statistics

(* Editor's note: A related post is here -- Only 20% are Middle-Class, Most Don't Come Close)

"Clowns to the left of me, jokers to the right, here I am, stuck in the middle with you."

Editor's Note: This is "part 2" to a previous article

Page Menu: Union versus Non-Union Wages | Low Wages Rule the Day | Poverty | The Top 1% | Households, in General | Two Income Households

Short Explanation of Mean and Median Numerals

There's a huge difference between the much reported "average household income" and what most people actually earn. The "median" is the "middle number" (in a sorted list of numbers). To find the median, place the numbers you are given in value order and find the middle number.

Example: find the median of 12, 3 and 5. Put them in order: 3, 5, 12. The middle number is 5, so the median is 5. If there are an even amount of numbers such as 3, 5, 8, 12 , find the value half-way between them, add them together and divide them by 2: (5 + 8 = 13 ÷ 2 = 6.5). And so, the "median" in this example is 6.5.

Mean Value - The "mean" is just the average of the numbers. Add up all the numbers, then divide by how many numbers there are. It really doesn't tell you very much regarding what most people actually earn without gathering all the data and computing the numbers. And someone has.


The total U.S. labor force is 153,392,000 with a participation rate of 64.2% because 139,764,000 are actually working, 18,425,000 were part-time, and 6,130,000 were unemployed over 6 months. 77.3 million Americans earn poverty wages and 8 million unemployed are no longer counted by the Bureau of Labor Statistics (they claim a much lower number).

The Bureau Labor Statistics reports "median" weekly earnings of the nation's 100.8 million full-time wage and salary workers were $769 in the first quarter of 2012 ($39,988 a year or $19.22 a hour). Women who usually worked full time had median weekly earnings of $697, or 82.2 percent of the $848 median for men.

Yahoo reports that based on date from Social Security, "while the average U.S. income last year was $39,959, the mean income — the figure where half earn more and half earn less — was much lower, $26,364. This disparity reflects the fact that "the distribution of workers by wage level is highly skewed."

50 percent of all wage earners had net compensation less than or equal to the median wage, which is estimated to be $26,363.55 a year for 2010. The U.S. Census Bureau defines "median income" as the amount which divides everybody's personal income into two equal groups, half having income above that amount, and half having income below that amount. More here from the Huffington Post.

Dean Maki, chief U.S. economist for Barclays Capital, says government reports from the U.S. Census, the Social Security Administration, and the Department of Labor's Bureau of Labor Statistic often reflect "aggregate" or "average" incomes, which may be skewed by wealthier Americans. "The Sentier Research study is more indicative of a typical household", says Dean Maki.

Remember, a "median wage" or "mean" wage is not what most people actually earn, especially before taxes.

(* Editor's Note: I've often heard the media reports saying "the average American median wage in the U.S. is $50,000", or some such number they're always throwing around, and I always thought I earned much less than most other people...when in fact, we've all been getting under-paid for the last 30 years.)

(Back to top of page)

Union versus Non-Union Wages

The Bureau Labor Statistics reports in 2011 that the union membership rate--the percent of wage and salary workers who were members of a union--was 11.8 percent. The number of wage and salary workers belonging to unions was14.8 million. In 1983 the union membership rate was 20.1 percent and there were 17.7 million union workers.

Public-sector workers had a union membership rate (37.0 percent) more than five times higher than that of private-sector workers (6.9 percent). In 2011, 7.6 million employees in the public sector belonged to a union, compared with 7.2 million union workers in the private sector.

In 2011, 16.3 million wage and salary workers were represented by a union. This group includes both union members (14.8 million) and workers who report no union affiliation but whose jobs are covered by a union contract (1.5 million).

In 2011, among full-time wage and salary workers, union members had median usual weekly earnings of $938 ($48,776 a year before taxes) while those who were not union members had median weekly earnings of $729 ($37,908 a year.)

Today day in 2012 the average mean wage for a steelworker is $24.11 an hour, or $50,160 a year -- about what a typical teacher, fireman, or police person might earn. That's because they are represented by unions, and their wages have kept pace with the rising cost of living over the past sixty years. They're not over-paid as the Republicans like say, they're just earning an average and comfortable middle-class living....like most of us did back in the 1950s.

I calculated that a middle-class wage today would be about $21.63 an hour BEFORE payroll taxes, not including emergency savings for repairs, clothes, entertainment, or a savings account for retirement and college. More here...

(Back to top of page)

Low Wages Rule the Day

The Bureau Labor Statistics reports in 2011, 73.9 million American workers age 16 and over were paid at hourly rates, representing 59.1 percent of all wage and salary workers. Among those paid by the hour, 1.7 million earned exactly the prevailing Federal minimum wage of $7.25 per hour. About 2.2 million had wages below the minimum. Together, these 3.8 million workers with wages at or below the Federal minimum made up 5.2 percent of all hourly-paid workers.

In the gray area of the chart below, the male and female median individual incomes are added together and then divided by 2 for a median income of $26,598 a year. That was in 2003; seven years later it's gone down to $26,363 a year -- or based on a 40-hour week, a median hourly wage of $12.67 in this income group.

Most new jobs are in the service industry and pay less that $10 an hour. (See a list of jobs with wages near the bottom) The most dominate occupations in the U.S. today: (Source: Bureau of Labor Statistics)

  • Office and Administrative Occupations 21.4 million
  • Sales and Related Occupations 13.6 million
  • Food Preparation and Serving Related Occupations 11.2 million
  • Transportation and Material Moving Occupations 8.6 million
  • Education, Training, and Library Occupations 8.4 million
  • Production Occupations 8.4 million. Manufacturing was once our most dominate occupation. Last year Representative Betty Sutton, in a speech to the House of Representatives, noted that just between 2001 and 2010 alone, America has lost over 56,000 factories. Politifact rated her claim "true".

The "median" hourly wage in this group is $16.57 and the "mean" annual wage is $45,230. The national average wage index for 2010 was $41,673.83

(Back to top of page)

The Top 1%

Meanwhile, CEO pay has skyrocketed in that same period of time, averaging near $13 million a year in 2011. A 2006 analysis of IRS income data by economists Emmanuel Saez at the University of California, Berkeley and Thomas Piketty at the Paris School of Economics showed that the share of income held by the top 1% was had already been as large in 2005 as it was in 1928.

EPI researchers found that the wealthiest 1 percent of U.S. households had net worth that was 225 times greater than the typical median household's net worth. That disparity, according to EPI, is the highest ratio on record.

1.4 million make up the very top quintile of taxpayers.

Based on 2009 tax year filing data, the Internal Revenue Service says an adjusted gross income, or AGI, of $343,927 or more will put you in the top 1 percent of taxpayers. A married couple with two kids and combined earnings of $343,927 or more also was among the top earners in the country.

The 1.4 million Americans in the IRS' top taxpayer category reported nearly 17 percent of all the country's taxable income. From those filers, the IRS collected $318 billion or almost 37 percent of all the individual taxes paid.

The Tax Policy Center in Washington, D.C., a joint venture of the Urban Institute and Brookings Institution, ran an economic simulation model that showed the top 1 percent of earners in 2009 made $503,086. TPC projects $516,633 as the cutoff for the top earners in 2010 and $532,613 for 2011.

(Back to top of page)

Poverty

The nation's official poverty rate in 2010 was 15.1 percent, up from 14.3 percent in 2009 ─ the third consecutive annual increase in the poverty rate. There were 46.2 million people in poverty in 2010, up from 43.6 million in 2009 ─ the fourth consecutive annual increase and the largest number in the 52 years for which poverty estimates have been published.

The number of people without health insurance coverage rose from 49.0 million in 2009 to 49.9 million in 2010, while the percentage without coverage −16.3 percent - was not statistically different from the rate in 2009.

  • 55.8 million receive some form of Social Security benefits (retirement averaged $14,760 a year and those on SS disability averaged $13,332 a year).
  • Of the 12.7 million who are unemployed, only 6.7 million currently receive unemployment benefits ($15,340 a year).
  • 8 million exhausted all their unemployed benefits without ever finding work again. ZERO income.

Squeezed by rising living costs, a record number of Americans — nearly 1 in 2 — have fallen into poverty or are scraping by on earnings that classify them as low income.

Sheldon Danziger, a University of Michigan public policy professor who specializes in poverty, says "If Congress and the states make further cuts, we can expect the number of poor and low-income families to rise for the next several years."

Among those requesting emergency food assistance, 51 percent were in families, 26 percent were employed, 19 percent were elderly and 11 percent were homeless.

And we already know what to expect from the Republicans and their right-wing advocacy groups such as the Heritage Foundation (called "think tanks", but are more like lobbyists). They are all denying these statistics so as not to have taxes raised on millionaires and billionaires, which are now historically low. Tax Rates on from1862 to 2012.

Many formerly middle-class Americans are dropping below the low-income threshold — roughly $45,000 for a family of four — because of pay cuts, a forced reduction of work hours or a spouse or both losing their job.

About 97.3 million Americans fall into a low-income category and 49.1 million who already fallen below the poverty line and are counted as poor, number 146.4 million, or 48 percent of the U.S. population (10.2 million had been added just since the recession that began in late 2007).

Paychecks for low-income families are shrinking. The inflation-adjusted average earnings for the bottom 20 percent of families have fallen to just under $15,000 a year, and earnings for the next 20 percent have remained flat. In contrast, higher-income brackets had significant wage growth since 1979, with earnings for the top 5 percent of families climbing 64 percent to more than $313,000.

Fifty percent of U.S. workers earned less than $26,364 last year. Despite population growth, the number of Americans with jobs fell again last year, with total employment of just under 150.4 million — down from 150.9 million in 2009 and 155.4 million in 2008. In all, there were 5.2 million fewer jobs than in 2007, when the deep recession began, according to the IRS data.

Median compensation last year was just 66 percent of the average income, compared with nearly 72 percent in 1980.

Per capita income is total personal income divided by the total population. Median household income is the income of the "middle" household. When the household income distribution is arranged in order from lowest to highest, half of all incomes are below and half are above the median.

U.S. Census data show that from 2000 to 2010, median income in the U.S. declined 7 percent. And the outlook for recouping lost earnings isn't good, according to a recent Wall Street Journal survey of economists. The economists told the newspaper they expect inflation-adjusted incomes to rise only 5 percent over the next decade.

(Back to top of page)

Households, in General

The Bureau Labor Statistics reports (PDF) 141,006,000 million "employed" households. As of 2009 from the U.S. Census (PDF): There were 60,844,000 married couples, of which 33,249,000 both worked.

Real "median household income" is also still 7% lower than it was in December 2007 and 3.9% lower than in June 2009, when the recession officially ended, says a study by Sentier Research. On top of that, we had 2.5% inflation this year and 3.3% in 2011, as wages remain low while the cost of living keeps rising.

According to the last U.S. Census, there were 114,235,996 households, and according the Bureau of Labor Statistics, the number of families with at least one member unemployed was 9.0 million in 2011.

Americans' incomes continued to fall in the recovery, Sentier data show, as more workers found fewer jobs and many of the unemployed took lower-level positions to get by on. There are currently 7.7 million who are only working part time but wanted full-time work.

Reuters reported on October 2011) that "median annual incomes" (adjusted for inflation) dropped 6.7 percent between June 2009 and June 2011, more than double the 3.2 percent drop experienced during the recession. This knocked real MEDIAN ANNUAL HOUSEHOLD INCOME down to $49,909 in June 2011 from $55,309 in December 2007, when the recession began. "Essentially, American households continued to lose ground." By spring 2011, the number of doubled-up households had increased by 2.0 million to 21.8 million.

The U.S. Census reports a similar number before it dropped, that "median household income" in the United States in 2010 was $49,445 (that would be an individual mean income of $24,722 per person in two income households, a 2.3 percent decline from the 2009 median income.)

U.S. Census: Income, Expenditures, Poverty, & Wealth: Household Income (Excel 98k and PDF 60k)

(Back to top of page)

Two Income Households

With the emergence of a two-tier labor market, the economic benefits and life chances have considerably shrank for the lower middle class, that had needed two income earners in order to sustain a comfortable middle-class standard of living.

The national MEDIAN wage (the middle, not average, for all earners) for individuals is approximately $32,000 and $46,000 for households. In terms of personal income distribution, the growing lower middle class could have gross annual personal incomes ranging from about $32,500 to $52,800 a year. But the working class majority earns $14.40 an hour or less (about $32,000 or less annually) and would need to earn at least $28.00 a hour to sustain a family of four they way someone could 60 years ago without a second income. 53% of all Americans are now members of the working or lower classes.

Such households could boast annual incomes ranging from $35,200 to $52,800, and thus be located in the MIDDLE of the income range, are sometimes referred to as being middle class, but in reality, cannot afford a real middle class lifestyle with the rising cost of living.

The definition of "Dual Income, No Kids" or DINKS, is a household in which there are two incomes and no children (either both partners are working or one has two incomes). DINKS are often the target of marketing efforts for luxury items such as expensive cars and vacations. Or DINKY, an acronym meaning "Dual (or Double) Income, No Kids Yet/Yuppie".

But these days most people need a two income household...from various sources:

  • The Department of Labor says, "Between 1996 and 2006, the number of dual-income families increased by 31%, from 25.5 to 33.4 million families.
  • According to Bureau of Labor Statistics data from 2010, in families with children, 58% of households had two working parents.
  • Here it says, "In 2007 the U.S. Labor Department reported that 57 percent of all married couples, both husbands and wives worked."
  • And of all households: Dual-income families accounted for 43.6 percent, single-income homes for 42.3 percent, and elderly couples who do not work made up 14.1 percent.
  • Wiki says, "In 2005 the U.S. Census Bureau reported that 42% of all households had two income earners.
  • Bureau of Labor Statistics: "Dual-earner couples are swiftly replacing the traditional married-couple model of a "breadwinner" husband and "homemaker" wife. From 1970 to 1993, the proportion of dual-earner couples increased from 39 percent to 61 percent of all married couples."

While households with just one income earner, most commonly the male, were the norm in the middle of the 20th century, 42% of all households and the vast majority of married couple households now have two or more income earners. With so many present day households having two income earners, a substantial increase in HOUSEHOLD INCOME is easy to explain.

Elizabeth Warren, Harvard Magazine: "The typical middle-class household in the United States is no longer a one-earner family, with one parent in the workforce and one at home full-time. Instead, the majority of families with small children now have both parents rising at dawn to commute to jobs so they can both pull in paychecks... The only real increase in wages for a family has come from the second paycheck earned by a working mother."

(Back to top of page)

Unemployment

"A recession is when a neighbor loses his job. A depression is when you lose yours." - Ronald Reagan

Saturday, April 7, 2012

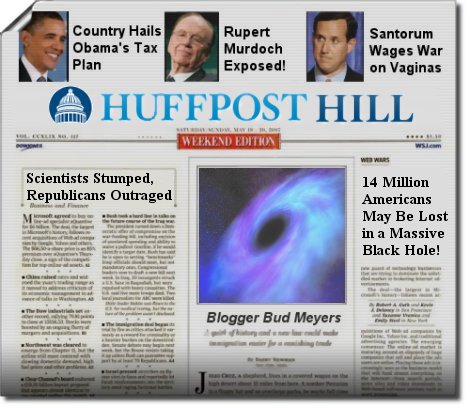
REPORT: 14 Million Jobless Americans May be Lost in Black Hole!

WASHINGTON D.C. - Scientific Journal (April 7, 2012) - In an odd and unexplained phenomena, 14 million Americans were suddenly and mysteriously missing by their friends, lovers, spouses, family members and neighbors...as well as by their own government.

If was horrifically freighting, almost like a scene out of The Twilight Zone, One Step Beyond, The Outer Limits, or an Alfred Hitchcock thriller.

A team of top scientists, here in the U.S. and around the world, have been working closely with the Department of Labor's Bureau of Labor Statistics to discover the whereabouts of 14 million formerly middle-class Americans, who just seemed to have completely vanished off the face of the Earth.

Some of the "esteemed" draft dodgers in congress had quipped that they might be listed as "MIA", and that they could just be lounging on a hammock in Hawaii.

What first started out as whimpers and rumors many months ago, blew up into a full scale scandal after a breaking news report yesterday.

The Huffington Post reported yesterday in their "DAILY DELANEY DOWNER" (HuffPost Hill newsletter): "Last March there were 1.8 million people who had been out of work for 99 weeks or longer. This March there were 1.9 million people who'd been unemployed that long."

The author of the very disturbing news release wishes to remain anonymous because he now works for the corporation AOL, which in turn, is partnered with Time Warner, one of the world's largest media companies, headquartered in the Time Warner Center in New York City. Among its many subsidiaries include New Line Cinema, Time Inc., HBO, Turner Broadcasting System, Warner Bros., Boomerang, Adult Swim, CNN, DC Comics, and Castle Rock Entertainment (Current TV is a progressive media company led by former U.S. Vice President Al Gore and could get kicked off of Time Warner).

The jobless numbers had stumped some the brightest minds in the world, so they started digging a little deeper. They all worked diligently, night and day, pounding on calculators, slide rules, and computers. They searched the National Archives, the Library of Congress, the IRS, and the Social Security Administration - - as well as the records from the NSA, FBI, NASA, and CIA. They left no stone overturned.

This is what they've managed to find out so far:

Two and half years ago (130 weeks ago) in October of 2009, 15.9 million Americans were out of work when the unemployment rate was reported to be 10.2%.

So the world's brightest sat down and did some simple math:

15.9 million Americans who were out of work 130 weeks ago - 1.9 million who were just reported as being unemployed over 99 weeks = 14.0 million"missing" Americans.

Did all 14 million of these people find jobs since that time, and are no longer unemployed? Or are they just ignored and no longer counted? (And what about the additional 6 million Americans who graduated from high school and college since that time? Did they all find jobs too?)

People are starting to demand answers to this grave and terrible mystery. Like Obama says, "It's math!"

(Below) Some scientists have even suggested that millions of America's unemployed might have all been lost in a massive Black Hole, mostly sucked in by apathy and indifference.

Congress is launching a full-fledged investigation into the matter, in case these "missing" Americans might be in need of some financial and medical assistance...such as food stamps and Medicaid.

The Republicans are especially concerned, and blamed Obama for being excessively cruel and miss-treating the poor and down-trodden.

When Republican Speaker of the House John Boehner was asked about the possibility of giving up on the search for 14 million destitute and suffering American citizens, he angrily responded, "Hell no we won't!"

When pressed further, John Boehner said a few Democrats and all the Republicans were willing to do all they can to find the 14 million Americans and provide them with food, so long all there were off-setting costs in Social Security and Medicare, and that there were also more tax cuts for the rich.

"We have a spending problem, not a revenue problem," he added. "We need to provide certainty for the job creators."

(Below) - John Boehner answering reporter's questions while stumping for Paul Ryan's austerity budget plan.

Updates soon.

Tuesday, January 10, 2012

The Jobless Numbers: A Prologue to Farce and Tragedy

I am a big fan and great admirer of Robert Reich. After reading his latest article at the Huffington Post about the unemployment numbers, I felt compelled to comment. (It's worth mentioning he was the Secretary of Labor under President Bill Clinton from 1993 to 1997).

He stated in his article that "the Bureau of Labor Statistics, which measures the unemployment rate every month, counts people as unemployed only if they're looking for work. If they're too discouraged even to enter the job market, they're not counted."

Now examine that statement very carefully. What part (or parts) of that sentence just doesn't ring true?

First of all, after someone's unemployment benefits expire, where do they sign in, or who do they report to, to let somebody know that they're still looking for work after their UI benefits expire? How could the Bureau of Labor Statistics possibly know if they are looking for work or not? (Please don't tell me a CPS household survey.)

Secondly, how does someone "re-enter" the work force if they want to be counted? Does this only happen when they get re-hired for work again? This whole notion of the Bureau of Labor Statistics determining this is just plain silly and doesn't hold any credibility.

I wrote to the Bureau of Labor Statistics to ask them about this:

"If the Social Security Administration and the Internal Revenue Service and all 50 states' Employment and Security Division had computerized records of EXACTLY when we worked, what we earned, where we were employed, how much tax we paid (or owed), and when we were no longer showing earnings on a W-4 form, can't all this information be easily cross referenced and shared (in part or completely) with the Department of Labor's Bureau of Labor Statistics?"

It seems this would be fairly easy to do. The Bureau of Labor Statistics would have an EXACT count, at any given time, of how many people are working and how many aren't. They could also say for certain how many people had exhausted all their unemployment benefits but still remain unemployed. And they could also determine EXACTLY what percent of high school and college graduates find jobs after completing school.

Also, I believe the CPA household survey is extremely obsolete and flawed in this day and age of technology.

The Bureau of Labor Statistics wrote me back:

"The QCEW program at BLS does part of what you suggest. They aggregate all the wage and salary data collected by the UI system. The methodology that you suggest for enumerating final exhaustions is a good one but you would also need to account for the high volume of churn in the UI system. Any claimants have been through the EUC 2008 system, as an example, two and even three times. To enumerate the final exhaustees, as you indicated, you would want those people who had received at least some UI during a specified time period, and then do not now show up on wage records and are not currently receiving UI. This has been proposed to some research consortiums. The primary issue is that the UI data (both wage, salary and benefit) is governed by some aggressive confidentiality laws so it’s not the case that anyone can simply get direct access to these systems."

Confidentiality laws? But, I digress...a little over two years ago (113 weeks ago) we had 15.7 million people unemployed in October of 2009 when the unemployment rate was at 10.2%. But as Robert Reich indicated, 10 million jobs were lost since the recession began, and because at one time, there were indeed 10 million people who were receiving either state or federal unemployment benefits. And by now they have all exhausted their jobless benefits (99 weeks was the max).

The Bureau of Labor Statistics says they "cannot determine the duration of unemployment for persons who had been unemployed for longer than 2 years for data prior to January 2011." Why can't they? Hmmmm?

They also say (as of December 2011) "The number of long-term unemployed (those jobless for 6 months or longer) was 5.6 million and accounted for 42.5 percent of the unemployed." Wow! Talk about under-reporting the jobless numbers! Two years ago we had 15.7 million, remember? And 10 million were once receiving UI benefits. How many net new jobs were created since October 2009?

NOTE: Per the current report from the Bureau of Labor Statistics...
  • The BLS concludes that only 13.1 million (8.5%) are unemployed in a work force with a "participation rate" of 64%.
  • 13.1 million is 8.5% of a workforce totaling 154.1 million people (154.1 million is 64% of 240.8 million if we had a "participation rate" of 100% for full employment).
  • 240.8 million MINUS 154.1 million in 64% work force = 86.7 million Americans of working age that doesn't have a job. (Subtract those that are retired, on disability, etc.)

Barely 3 million net new jobs were created since October of 2009, so at the very least, 12.7 million Americans must have been out of work for over 2 years or more - - - yet the media is parroting the Bureau of Labor Statistics by saying "1.9 million have been out of work for 99 weeks or more". That is numerically impossible.

And we also had many more layoffs since October of 2009. Add to that, we also had another 6 million high school and college graduates since that time as well. They ALL didn't just "drop out" of the labor force and move in to their parent's basement...they're just not counted. They've all just been swept under the statistical rug by the Department of Labor.

A few may have retired with reduced Social Security benefits if they were 62 or older, and some applied for Social Security Disability. Some might have left the country, and some could have started their own business. And some are being supported by others, as some passed away....but what about everybody else? Where did everybody else go?

According to www.shadowstats.com, the broadest official government measure of unemployment (U-6) is now at 15.2%. This includes "discouraged" workers -- if they've been "discouraged" for less than one year. The SGS unemployment figure of 22.4% includes the long-term unemployed and "discouraged." (I had earlier calculated almost 20% with 27 million now unemployed. That's 1 out every 5 working age adults.)

An update from the U.S. Department of Labor:
http://www.bls.gov/news.release/pdf/empsit.pdf

"Effective with the release of The Employment Situation for January 2012 scheduled for February 3, 2012, population controls that reflect the results of Census 2010 [rather than 2000] will be used in the monthly household survey estimation process. Historical data will not be revised to incorporate the new controls; consequently, household survey data for January 2012 will not be directly comparable with that for December 2011 or earlier periods."

Re-adjusted seasonal adjustments and revised census data should make for some ghastly unemployment reports in the near future.

Both major political parties skew the statistics for political purposes. But the Occupy Wall Street movement isn't a figment of your imagination, they're protesting for a reason...the numbers prove it.

And if you've read this far, you'll appreciate this jewel from James Madison in 1882:

"A popular Government, without popular information, or the means of acquiring it, is but a Prologue to a Farce or a Tragedy; or, perhaps both. Knowledge will forever govern ignorance: And a people who mean to be their own Governors, must arm themselves with the power which knowledge gives."

My Related Posts:

Thursday, December 29, 2011

The unemployed didn't just "drop out"

...they were pushed out of the labor force.

In a New York Times article today, titled Instead of Work, Younger Women Head to School, the author writes "Workers are dropping out of the labor force in droves, and they are mostly women."

The author goes on to say "These young women seem to be postponing their working lives to get more education. There are now — for the first time in three decades — more young women in school than in the work force." The article never mentions how many of these young women might have turned to prostitution and/or are working in strip clubs to survive...or to put themselves through school.

Lawyer turns topless dancer to pay the bills: How many have already graduated from school but still can't find work? Hard times push more women to strip clubs: "Among the usual aspiring actresses and dancers, there are more college students, single mothers trailing toddlers, health and office professionals and even a few age-defying grandmothers — all looking for well-paid work."

And how many are coping with the recession by growing and selling pot?

First of all, people don't voluntarily "drop out of the labor force" as the Bureau of Labor Statistics claim. They are just no longer counted after a certain amount of time after their unemployment benefits expire (labeled as "discouraged workers") The New York Times article just helped to perpetuate the myth that unemployed people just "turn on, tune in, and drop out".

Once someone's unemployment runs out, there's no place where one goes to sign in every week to show that they're still actively looking for work. After a certain amount of time the Bureau of Labor Statistics just arbitrarily makes the assumption they "gave up looking for work". But how could the BLS possibly know who's still looking for work and who was evicted and living in a homeless shelter? The BLS just bases their conclusions on who's exhausted all their unemployment benefits.

The Bureau of Labor Statistics denies this, saying they do not get any data from the state's unemployment offices (and rely on bogus household surveys), but yet the BLS posts the exact numbers of those who are receiving state and federal benefits in their monthly reports (subject to change every month when updated).

Secondly, only those who once had a two-income family (like a husband and wife, with one that's employed and earning enough to pay for food, rent, auto loans, car insurance, and school tuition) can the scenario that this article presents be possible. Or maybe the young women who are going to school also live at home with their parents, and they pay for their school and living expenses. Or maybe they work in a strip club.

But they didn't just "drop out" of the labor force, like kids "drop out" of high school. This maligns the unemployed as quitters or failures. As if they "dropped out of society", or voluntarily quit an assigned task, or failed at completing something. As if they were "losers".

In the real world, when some loses their only source of income, they look for a job to pay for food and shelter, unless they have the luxury and good luck to have someone else pay for their living expenses. They don't just "drop out" and casually return to college to improve their jobs skills.

American society has always maligned those who lost jobs and couldn't find employment through no fault of their own: “Three or four million heads of households don’t turn into tramps and cheats overnight, nor do they lose the habits and standards of a lifetime. They don’t drink any more than the rest of us, they don’t lie any more, and they’re no lazier than the rest of us. An eighth or a tenth of the earning population does not change its character which has been generations in the moulding, or, if such a change actually occurs, we can scarcely charge it up to personal sin.” – Harry Hopkins, Federal relief administrator under Franklin D. Roosevelt – 1933

The New York Times article today also says "412,000 young women have dropped out of the labor force entirely in the last two and a half years", but how can that be? Almost two and a half years ago in October of 2009 15.7 million Americans were unemployed when the unemployment rate was 10.2%. Only 412,000 young women are unemployed today?

And since then, all those people have already exhausted all unemployment benefits that they may have once been entitled to and qualified for - - - so most are no longer being counted. Since October of 2009 only 3 million jobs were created, and many more people have been laid off since that time. And now 7.2 million are currently receiving either state or federal benefits.

Also, since October of 2009 six million young people have already graduated from high school or college (not counting drop-outs), and most are still not finding jobs - - but instead, many are participating in Occupy protests.

The number in that New York Times article today is way out of line with reality. And to call them "drop outs" is disrespectful.

Break down:

  • Nearly 18 million Americans have at some point received federally funded extended unemployment benefits since 2008.
  • In October of 2009 the Bureau of Labor Statistics reported that the national unemployment rate was at 10.2% with 15.7 million Americans out of work.
  • In May of 2010 there were 10 million receiving either state or federal UI benefits.
  • In December of 2011 we have 7.2 million who are currently receiving either state or federal benefits, and 13.3 million are current being reported by the BLS as being unemployed.
  • Almost a total of 18 million received UI benefits and 6 million Americans also graduated from high school and college in the last two and half years, but only 3 million jobs were created.

Related Posts:

Where did 15 million jobless Americans go?

Simple Math Proves Jobs Report a Lie

Friday, November 11, 2011

Senator Jim DeMint on Veterans and Unemployment

I was born in 1955 when Dwight D. "Ike" Eisenhower was President of the United States. Then America was becoming increasingly involved in the Vietnam War. But America's involvement didn't officially began until 1961 when President F. John Kennedy sent 400 United States Army Special Forces personnel to South Vietnam to train South Vietnamese soldiers.

Before the war had ended, Senator Jim DeMint had been attending the Christ Church Episcopal School and the Wade Hampton High School in Greenville, South Carolina. His parents, Betty W. DeMint (née Rawlings) and Thomas Eugene DeMint (U.S. Air Force), had divorced when Jim was only five years old (His father had left his mother with four children.) Jim DeMint's mother later opened a dance studio out of the family's home called the DeMint Academy of Dance and Decorum.

Jim DeMint graduated from high school in 1969 when the Vietnam War had reached its peak. American forces had risen from 16,000 in 1964 to more than 553,000 by 1969 under President Lyndon Johnson.


In 1973, the year that the U.S. military had ended the draft, I had graduated from high school. Before that time it was mandatory by law that I must register for the draft. My Selective Service Number was 013. I still have my draft card. While although I was opposed to the Vietnam War, I didn't burn it.

By that time Jim DeMint was 22 years old when he had graduated from the University of Tennessee with a B.S. in communications and had married his high school sweetheart. In an interview he said, "My father-in-law would not give me a job until I earned an MBA, so I enrolled in graduate school at Georgia State.

Two years later the Vietnam War had ended on April 30, 1975 when the last U.S. Marines had evacuated the U.S. embassy in Saigon by helicopter. At this time Jim DeMint's bio implies he had been attending the Clemson University.

After graduating from Clemson with a MBA (12 years after graduating from high school), he returned to his hometown of Greenville, South Carolina in 1981.

According to the Veteran's Administration, nearly 3.5 million men served in the Vietnam theater of operations. The draft raised 2.3 million men for military service during the Vietnam era. It has also been credited with "encouraging" many of the 8.7 million "volunteers" to join rather than risk being drafted, and of those 153,452 were wounded, 1,711 remain missing (MIA), and 58,212 were killed in action (KIA).

How did Jim DeMint avoid the draft? Was his father a general in the Air Force and pulled strings to get him exempted? Or was Jim an outstanding college student with high marks in school and received a deferment? Or was he disqualified for physical or mental deficiencies - - - or for a criminal record? Or was he just real lucky for those four years after he graduated from high school until the U.S. government ended the draft?

Even though in 1969 under President Nixon the U.S. pull out from Vietnam had already commenced, REPLACEMENT personnel were still ROTATING "in country" up until 1975, when the embassy was evacuated by U.S. servicemen. (See the Draft Lottery of 1969). The last man who was actually drafted was Dwight Elliott Stone on June 30, 1973 (who was then a 24-year-old apprentice plumber from Sacramento, California and reluctantly became America's "last draftee.")

While in school, did Jim DeMint attend any of the anti-war war protests or rallies on the college campuses, or did he think they were all a bunch of dirty long-haired dope-smoking hippies?

Today the radical Tea Party Senator Jim DeMint is known as a "Chicken Hawk", people who are enthused about their country engaging in war (which is why they're called "hawks"), but who makes sure that their own asses are nowhere near the fighting – which makes them "chicken" - so therefore Chicken Hawk (DeMint voted YES on authorizing military force in Iraq.)

In touting his support for the war in Iraq, he told an audience in May 2007, “Al-Qaida knows that we’ve got a lot of wimps in Congress. I believe a lot of the casualties can be laid at the feet of all the talk in Congress about how we’ve got to get out, we’ve got to cut and run.” Very brave words spoken from the elegant halls of Congress.

"HELL NO! YOU CAN GO!" - Here is the web's most thorough chicken hawk database of current senators, prominent Republican politicians and other famous pro-war conservatives. All have advocated for war, while none have seen active service.

- - - - Gulf War-era II - - - -

As of 2010, about 2.2 million of the nation's veterans had served during the Gulf War-era II. To date: 6,274 U.S. service members have died in Operation Iraqi Freedom and Operation Enduring Freedom.

President Obama recently announced that the majority of the troops now serving in Iraq (46,000) are scheduled to return home by the end of 2011.

Jim DeMint says he's "fiscally conservative". The most recent major report from Brown University in the form of the Costs of War Project said that the total cost for wars in Iraq, Afghanistan, and Pakistan will cost the U.S. taxpayers at least $3 trillion*.

* Many of the wars’ costs are invisible to Americans, buried in a variety of budgets, and so have not been counted or assessed. For example, while most people think the Pentagon war appropriations are equivalent to the wars’ budgetary costs, the true numbers are twice that, and the full economic cost of the wars much larger yet. Conservatively estimated, the war bills already paid and obligated to be paid are $3.2 trillion in constant dollars. (A more reasonable estimate puts the number at nearly $4 trillion.)

According to the Bureau of Labor Statistics, young male veterans (those ages 18 to 24) who served during Gulf War-era II (from 2003 to the present) had an unemployment rate of 21.9 percent last year. All Gulf War-era II veterans, off all ages combined, who were current or past members of the Reserve or National Guard, had an unemployment rate of 14.0 percent in July 2010. About 25% of Gulf War-era II veterans who served in Iraq and/or Afghanistan returned with a service-related disability.

Gulf War-era II veterans were twice as likely to work in the public sector as were non-veterans (30 percent and 15 percent respectively). In July 2010, approximately one-third of Gulf War-era II veterans reported that they had served in Iraq, Afghanistan, or both. These veterans had an unemployment rate of 14.3 percent.

Yesterday the Senate voted 95-0 in favor of legislation that would provide employers with tax credits for hiring long-term unemployed and wounded veterans. These benefits were approved as an amendment (S.927) to the 3% Withholding Repeal and Job Creation Act (H.R. 674) that the House of Representatives had cleared in October.

Introduced by Sen. Jon Tester (D-MT), the VOW to Hire Heroes Act of 2011 amendment would provide employers with a “Returning Heroes” tax credit of up to $5,600 for hiring veterans who have been unemployed for at least six months, a $2,400 credit for hiring veterans who have been unemployed for more than four weeks, but less than six months, and a credit of up to $9,600 that would increase the existing Wounded Warriors Tax Credit for employers that hire veterans with service-connected disabilities who have been unemployed for at least six months.

These credits were initially included in President Obama’s more comprehensive job stimulus bill, the American Jobs Act (S. 1660), which stalled in the Senate last month. The Senate agreed to include the VOW to Hire Heroes amendment to H.R. 674 by a vote of 94-1 before passing the entire measure.

South Carolina's Jim DeMint had initially been the only senator who opposed passing a portion of President Obama's job's plan that gives businesses tax credits for hiring veterans. He said," I know what I am about to discuss won’t be very popular -- I'll probably be accused of not supporting veterans by the politicians pandering for their votes."

DeMint initially called the legislation a "trick" by the Obama administration and Democrats.

AS AN ASIDE: Why was the VOW to Hire Heroes amendment not a separate bill, but instead added as an amendment to the Withholding Repeal and Job Creation Act (H.R. 674), which repeals a three percent withholding tax that was supposed to help the federal government crack down of contractor fraud?

Yesterday Jim DeMint had a change of heart and this "repeal bill" with passed unanimously. (It almost reminds me of when last year the Republicans would only vote to extend unemployment benefits for one more year, but only if the Bush tax cuts were extended 2 more years for the wealthy. Why weren't these 2 bills also separate?)

Senator Jim DeMint has said we should not extend unemployment benefits because "people are gaming the system and refusing to take jobs because they get unemployment benefits and food stamps."

Unemployment Compensation for Ex-service members (UCX)

In most cases military veterans must have been separated under honorable conditions to be eligible for unemployment benefits (usually after serving in active duty for at least 24 months.) Each state may have unique rules or provisions. Check with your state employment office for specific information. Be sure to have the following documents: job history or resume, Social Security Card and a DD Form 214 (Certificate of Release or Discharge from Active Duty). If you receive other compensation (such as separation pay or retirement pay) the amount of compensation for which you may be eligible will be reduced. For a list of this and other services for military veterans, go here: http://www.va.gov/opa/publications/benefits_book/benefits_chap10.asp

- - - - - Jim DeMint's Obsession with Taxes - - - - -

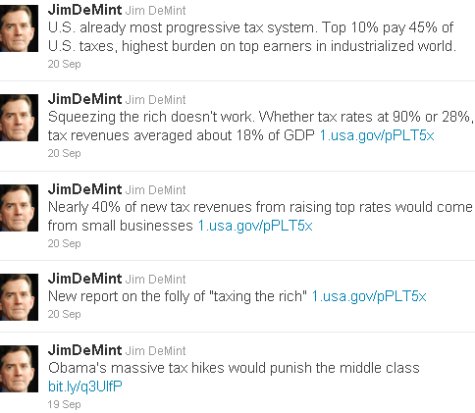
The United States already has some of the lowest tax rates in its history, but Senator Jim DeMint can't stop whining about raising taxes (I get this same crap in newsletters from the Tea Party all the time. They're outright lies) Jim DeMint is just fear-mongering when he claims that raising taxes on millionaires and billionaires will hurt small businesses and the middle-class, which is not true at all (how much have the budgets suffered with the Bush tax cuts already? The Republicans just want more of the same!)

Check out some of Jim DeMint's latest Tweets below (total B.S.)

Jim DeMint called for replacing the graduated income tax with a national sales tax, or a flat tax, and called for individual retirement accounts in Social Security. In 2003, he sponsored unsuccessful legislation to allow people under the age 55 to set aside 3% to 8% of their Social Security withholding income (that's invested in U.S. Treasury Bonds) and put their money into "personal investment accounts" (the free-wheeling and volatile stock market). He tried to substitute President Barack Obama’s 2009 economic stimulus bill with one that contained only tax cuts. Jim DeMint and his radical Tea Party "patriots" want cuts to Social Security, Medicare, Medicaid, TANF, food stamps, and unemployment benefits...government services that millions of U.S. military veterans rely on to survive.

Draft dodgers like Jim DeMint, who refused to risk their own life in the service to their country, but allowing others to die in their shoes while sending others in harm's way, wants to collect his own generous government-subsidized salary while allowing others to starve. "Patriot" or cowardly hypocrite?

My father volunteered to serve in the Korean War and he also did two tours of duty in Vietnam, coming home in 1969. And he was drawing Social Security after he retired before he passed away several years ago. Happy Veteran's Day dad!


Kill everyone who relies Social Security, Medicare, Medicaid, TANF, and food stamps.

DeMint backed by the Club for Growth to let poor people die!

Thursday, November 10, 2011

6 Million Graduates Not Counted in Unemployment Rate

From high school or college to being unemployed...but not being counted in the unemployment rate. Let's take a jobless walk down Memory Lane (Time-line: Late 2008 to the present in 2011.)

The Bureau of Labor Statistics reports that in just the past 2 years we gained 1.8 million NET new jobs, lowering the unemployment rate from 10.2% in October 2009 to 9% in October 2011. They're saying we went from 15.7 million unemployed in October of 2009 to 13.9 million unemployed in October of 2011. REALLY? I suppose this could be true, but only if since October of 2009:
  • No one else was ever laid off and/or no other jobs were outsourced overseas,
  • And EVERYBODY who graduated from high school found a job.

Or vice versa, and 1.8 million more Americans were laid off since October 2009 until the present date, but NOBODY who ever graduated from high school during those 2 years had ever found a job (and that's not even counting the 4 million young people who were also attending college).

So I further submit that as October 2011, of the 10 million Americans who were at one time receiving either State of Federal unemployment benefits as of May 2010, 7 million have already exhausted all their qualifying UI benefits, and they are no longer being counted in either the media's reported U-3 unemployment rate, or in the Bureau of Labor Statistics' reported U-6 rate (as either "marginally attached" or "discouraged workers"); and that the ACTUAL number of Americans that are still unemployed today in closer to 21 million, and not 13.9 million that's being reported today.

And because of this, the Bureau of Labor Statistics is saying we have a "reduced work force" and a "lower participation rate".

Additionally, by the end of this year, we will also have approximately 4 million more people without UI benefits if they are not funded by congress, bringing to a total of over 11 million people with no job and no income at all. By comparison, 12 million Americans were unemployed at the height of the Great Depression in 1933 when there was no unemployment insurance...but because the population was a lot less then than it is today, the unemployment "rate" was higher.

How many NET new jobs were created since October of 2009 (during the past 2 years) when the Bureau of Labor Statistics reported 15.7 million Americans were unemployed and the unemployment rate was 10.2%?

The Bureau of Labor Statistics reported that as of October 2011 we have 13.9 million unemployed Americans with an unemployment rate of 9%. (I use links to the New York Times because the Bureau of Labor Statistics link to current updates changes every month).

So according to the Bureau of Labor Statistics, in the past 2 years we're gained 1.8 million net new jobs and the unemployment rate went down from 10.2% to 9%.

We can also assume that many of those newly created private sector jobs were also canceled out by layoffs in the public sector, and that many of the newly created jobs were also part-time low-paying positions as employers have been reducing hours and lowering wages to cut their costs.

So now the question remains, how many Americans were laid off since October 2009 to October 2011, but were never replaced, either due to corporate down-sizing or to outsourcing overseas?

Now the question must also be asked, if according the Bureau of Labor Statistics we also had approximately 2 million young people who graduated from high school since October of 2009 (but did not enter college), were they excluded from the unemployment numbers? If so, then for every high school graduate that's added, that must mean one new NET job must be reported (Could all 1.8 million net new jobs that were created since October 2009 have all been filled by high school graduates?)

We already had 11 million Americans unemployed in January 2009, but just for the sake of argument (to make it much simpler to calculate), let's just go back exactly 2 years ago to October 2009. The U.S. Bureau of Labor Statistics subtracted 1.8 million people from the total of those unemployed since 2 years ago, even after all the additional layoffs since that time, and after 2 million more young people have graduated from high school over the last 2 years.

October 2009 15.7 million unemployed 10.2% unemployment rate 2 years ago
From October 2009 to October 2011

?

< plus 2 million high school grads in 2010 and 2011
From October 2009 to October 2011

?

< minus public sector layoffs due to budget cuts
From October 2009 to October 2011

?

< minus private sector layoffs (permanently laid off or outsourced overseas)
From October 2009 to October 2011

?

< plus NET private and public sector new jobs added (either full-time or part-time)
From October 2009 to October 2011

?

< minus those who couldn't find work, were forced into early Social Security or disability, and were no longer counted
From October 2009 to October 2011 - 1.8 million (difference) < sub-total + 1.8 million net jobs reducing the jobless rate
October 2011 13.9 million unemployed 9% current unemployment rate today

* According to this source, there has been a total of 863,000 private sector jobs that were created in 2010 - - - which was more private job creation than during the entire 8 year tenure of George W. Bush. This was proceeded with 15.4 million people being unemployed in December of 2009 with an unemployment rate of 10%. So simple arithmetic would tell me that about 1 million more NET jobs were added since that time - - - to make a total of 1.8 million net new jobs (either full-time or part-time) that were created to lower the unemployment rate from 10.2% in October 2009 to 9% in October 2011.

So the final question is: "Who's not being counted and how many invisible Americans are really out there?" (And will the Bureau of Labor Statistics ever tell us the truth?)

Time Line of Pertinent Figures and Facts Reported by the Media covering late 2008 to the present.

January 9, 2009 - America lost 1.9 million in the final four months of 2008 when AIG failed after the credit crisis began in September, bringing the year's total job losses to 2.6 million, or the highest level in more than six decades. The unemployment rate rose to 7.2%, its highest rate since January 1993. The total number of unemployed Americans rose to 11.1 million. Those working part-time jobs because they couldn't find full-time work or their hours had been cut (the "under-employed) jumped to 8 million, the highest since such records were first kept in 1955. The average hourly work week fell last month to 33.3 hours - the lowest level in history. The average weekly paycheck fell to $611.39 (or $31,792.28 a year).

January 30, 2009 - Bloody Monday: Over 65,400 Jobs Lost - About 200,000 more job cuts have been announced so far this year, according to company reports. Nearly 2.6 million jobs were lost over 2008, the highest yearly job-loss total since 1945.

February 6, 2009 - Over the last 13 months, our economy has lost a total of 3.6 million jobs - and continuing job losses in the next few months are predicted.

February 6, 2009 - The Labor Department said that almost 600,000 jobs disappeared in January and that a total of 3.6 million jobs had been lost since the beginning of the recession in December 2007. The unemployment rate, meanwhile, rose to 7.6 percent.

March 6, 2009 - Government data revealed that 651,000 more jobs disappeared in February. The unemployment rate surged to 8.1.“These jobs aren’t coming back,” said John E. Silvia, chief economist at Wachovia in Charlotte, N.C.

April 3, 2009 - Unemployment rate spikes to 8.5%, a 25-year high. 5.1 million jobs have now been lost since the beginning of 2008. Employers cut back the number of hours for their workers as well. The average hourly work week fell to 33.2 hours, the lowest level on record going back to 1964. A record 9 million Americans were "underemployed" in March.

May 8, 2009 - With an additional 539,000 jobs lost last month, the unemployment rate is pushed to 8.9%

July 2, 2009 - The American economy lost 467,000 more jobs in June, and the unemployment rate edged up to 9.5 percent in a sobering indication that the longest recession since the 1930s had yet to release its hold. The average length of official unemployment increased to 24.5 weeks — the highest level since the government began tracking such data in 1948. The unemployment rate, 9.5 percent, is the highest since 1983.

October 2, 2009 - The economy shed 263,000 jobs in September, and the unemployment rate edged up to 9.8 percent from 9.7 percent in August. Though the job market worsened, the pace of deterioration remained markedly slower. As of the third quarter of 2009, there are 12.5 million unemployed native-born Americans, but the broader U-6 measure shows 21 million natives unemployed or underemployed. (Full break down in demographics).

November 14, 2009 - The official unemployment rate is already 10.2% and another 200,000 jobs were lost in October, when you include discouraged workers and partially employed workers the figure is a whopping 17.5%. While losing 200,000 jobs per month is better than the 700,000 jobs lost in January. Many firms are telling their workers to cut hours, take furloughs and accept lower wages. Many of the lost jobs are gone forever, including construction jobs, finance jobs and manufacturing jobs. Recent studies suggest that a quarter of U.S. jobs are fully out-sourceable over time to other countries.

January 8, 2010 - Number of long-term unemployed hits highest rate since 1948. In the December unemployment report, the Bureau of Labor Statistics said the number of people out of work for 27 weeks or more hit 6.1 million Americans, or 40 percent of all 15.3 million jobless.

February 5, 2010 - The government's monthly job report on Friday showed that the disastrous labor situation plaguing the nation's economy is moderating. But the report also underlines an unsettling reality: 8.4 million jobs have been vaporized since the recession began. The unemployment rate was 9.7% in January. Economists estimate that the country needs to create at least 125,000 jobs per month just to keep up with the nation's expanding job force. That translates into 11 million jobs just to get back to the 5% unemployment rate from before the recession.

June 10, 2010 - Continuing State claims numbered 4.5 million when the U-3 unemployment rate was reported as 9.7% - and at this time nearly 5.4 million Americans were also receiving Federal Extended Benefits for a total of about 10 million people who were either receiving State UI or federal UI benefits. So how could only 8.4 million jobs have been vaporized since the recession began?

July 2, 2010 - 7.9 million jobs lost - many forever. "The nation's working-age population grows by about 150,000 people a month." * So the hole is deeper than it looks. It would take the creation of 10.6 million jobs immediately for the same percentage of the population to be working as was the case three years ago. (Again, how can only 7.9 million jobs be reported lost if 10 million people are collecting benefits? And that's not even counting those who never qualified.) * U.S. Census: The U.S. population increased from 281,424,603 in 2000 to 308,745,538 in 2010. --- 27,320,935 divided by 120 months = 227,674 a month in average population growth.

August 5, 2010 the NY Times reported the tally of laid-off workers that were continuing to claim unemployment benefits was 4.54 million, and an additional 3.90 million people receiving extended unemployment benefits (total: only 8.44 million).

August 18, 2010 - "Suicide is potentially a very large problem as the recession continues, with 6.6 million Americans out of work for six months or more."

December 25, 2010 - The Bureau of Labor Statistics will raise from two years to five years the upper limit on how long someone can be listed as having been jobless. Nearly 10% of the USA's 15.1 million jobless have been looking for work for two years or more. (I, and many others, were laid off in late 2008. Only 10% were jobless for 2 years or more? Bullshit!)

December 29, 2010 - Last month 4.67 million people were receiving federal extended unemployment benefits and 4.06 million people that are currently counted as receiving traditional continued unemployment benefits for a total of 8.73 million people on state and federal unemployment rolls when the unemployment rate was reported at 9.8%.

January 10, 2011 - Incredibly, the U.S. labor force is now smaller than it was before the recession started, though it should have grown by over 4 million workers to keep up with working-age population growth over this period.

January 24, 2011 - There are 1.4 million "very long-term unemployed" who have been out of work for 99 weeks or longer...The 1.4-million figure, calculated using the latest data available as of October, is much smaller than some home-cooked estimates circulated online by advocates for additional weeks of benefits for these "99ers." Some of those estimates are as high as 7 million. BLS: "The total number of people claiming benefits in all programs for the week ending Jan. 1 was 9,607,423."

March 18, 2011 - Researchers at the National Employment Law Project (NELP) recently estimated that during 2010 there were 3.9 million workers who were jobless when they received their final payment of eligible unemployment insurance. A report last December from the President's Council of Economic Advisors included a projection of roughly the same number of UI exhaustees during 2011.

June 13, 2011 - About 6.2 million Americans, 45.1 percent of all unemployed workers in this country, have been jobless for more than six months - at its highest since the Great Depression.

July 14, 2011 - More than 6.3 million Americans have been out of work for more than half a year. The average jobless stint now lasts longer than nine months.

August 8, 2011 - About 13.9 million Americans remain unemployed, and of those, 44.4% have been out of a job for more than six months."

September 2, 2011 - The general unemployment rate, which counts only people who looked for work in the previous four weeks, held steady at 9.1 percent. A broader measure that includes people who have looked for work in the last year and people who were involuntarily working part time instead of full time increased slightly to 16.2 percent. The percent of working-age adults who were employed, already at its lowest rate since 1983, was at 58.2 percent.

October 2, 2011 - With an estimated three-quarters of the 14 million unemployed Americans out of work for more than six months and fully half out of work for more than two years, many jobless Americans are falling into despair as repeated attempts to find work come up short.

November 2011 - "The total number of people claiming benefits in all programs for the week ending October 22 [2011] was 6,835,604." (Prior year-to-date 8,708,828)

November 4, 2011 - "...an economy that isn’t creating enough jobs to keep up with population growth. While the unemployment rate dipped slightly, from 9.1 to 9.0 percent, the drop was so slight that it might well be a statistical anomaly." A statistical anomaly?!?!

*** I say there are AT LEAST 21 million unemployed, and there are 14 million Americans who have been unemployed for almost 3 years. (I know, I'm one of them.)

E-MAIL TO THE BUREAU OF LABOR STATISTICS
----- Original Message -----
From: Bud
Sent: Thursday, November 10, 2011 8:51 PM
Subject: Unemployment numbers

If the Social Security Administration and the Internal Revenue Service and all 50 states' Employment and Security Division had computerized records of EXACTLY when I worked, what I earned, where I was employed, how much tax I paid (or owed), and when I was no longer showing earnings on a W-4 form, can't all this information be easily cross referenced and shared (in part or completely) with the Department of Labor's Bureau of Labor Statistics?
It seems it would be fairly easy to do. You would have an EXACT count, at any given time, of how many people are working and how many aren't. You could also say for certain how many people had exhausted all their unemployment benefits and still remain unemployed. You could also determine EXACTLY what percent of high school and college graduates find jobs after completing school.
The CPA household survey is extremely obsolete and flawed in this day and age of technology.
Please let me know if there is any effort under way to accomplish this.
Thank You.
Bud Meyers

Friday, February 11, 2011

"Being Cool in an Era of Age Discrimination"

"I'm bad. I'm cool. I'm a happening fool!"

I could simply say that getting old is as natural as being born and dying; and that unlike in America, other cultures respect and care for their elderly people...but my words would only be falling on deaf ears.

Boring!

I started this free blog because the website I once created and maintained for the last 7 years (http://www.tobuds.com/) went down when I no longer had the money to renew my hosting plan. After losing my job two years ago I began blogging about the economy and unemployment. This blog that I'm currently using was meant to be a continuation of another website I created (http://www.acompanyofone.org/) which focused primarily on the 99ers, the economy, corporate out-sourcing, labor statistics, government and corporate corruption, and the plight of the long-term unemployed.

And since age discrimination in job hiring has always been a problem for older people in America (such as the "99ers"), and has recently been more pronounced and much more open since the recession began, I thought I would write about being "cool" this morning (instead of my usual rants against the evil corporations and banks).

First off, let me start by saying that being truly "cool" is much more than a passing trend, the latest fashion, or the newest gizmo. True coolness is as timeless as a work of art, an idea, a philosophy, or a state of mind. A restored vintage Harley-Davidson motorcycle and the Great Pyramids of Egypt are both very cool. The latest cell phone has a very limited "cool factor" because in 6 months something newer comes along with more pixels for the camera and/or more megabytes of storage space (or whatever else happens to be more cool at the time).

When people are cool, they either are or they're not. Many people might say Bill Gates was a nerd when he started Microsoft - - - and even as a multi-billionaire, he might still be considered a nerd. Who would call him cool? Maybe when Windows 98 first came out everybody thought that THAT was REAL cool. But how cool was his Windows ME (Millennium Edition)?

Chances are, if you were cool in school 30 years ago, even if you're a grandpa today, you're probably still cool now. If you were a slovenly jock, you most likely still are today. The same goes for nerds, idiots, psychopaths, narcs, and do-gooders. It's a personality trait that's inherent in people, it doesn't necessarily go away with age, although it can. Just as nerds can grow up to become cool, and cool people in school can become dickheads when they become adults. It's all relative.

Age doesn't have to factor in to the "coolness aspect" of the individual; it's their inner karma, their relationship with the immediate environment, and what they have, or will, or can, exude in skill, grace, style, pizzazz, and innovation. Sometimes age itself is needed to have experienced all those cool things from the past, so that those experiences and ideas can be passed on to newer generations.

I know of lots of celebrities, actors, and musicians who are past 50 years old who I think are just as cool today as I thought they were 30 years ago. While some may have slid into obscurity, and others have fallen in disgrace, many others went on to maintain their coolness all through-out the years. Just because they're older doesn't necessarily make them less cool. Some may even think that Bill Gates (without his money and fame) is cool...I'm guessing his wife might think so. Is Mick Jagger nothing more than an un-cool old man today?

In a recent article featuring me in my local newspaper a couple people had made comments referencing my age in the profession of casino bartending - as though I were too old, not cool enough, and had overstayed my welcome in Las Vegas. This really pissed me off. I just turned 53 when I was laid off and those bozos thought it was time to put me out to pasture? Would the casinos turn down Mick Jagger for a bartending gig?

The people who say I'm too old to be a casino bartender also probably believe in the concept of Soylent Green too.

Lots of 21 year-olds think Jon Stewart is very cool and Jon will be half a century old next year. Should Jon be considered obsolete? Why don't all these young "cool" kids barf all over their TV sets whenever they see him? Not all young adults relate to "older" people as an extension of their own parents.

When I was 21 I owned cool things and did cool things and went to cool concerts and wore cool clothes and hung out with cool people and listened to cool music and went to cool clubs and visited cool beaches and dated cool girls who had cool friends who went to cool places...

...so I began to wonder, at what exact point in my life did I suddenly become "un-cool" and why? Was it when I first bought a house? Or when I stopped smoking pot? When I ran a small business? When my ex-girlfriend dumped me? I still like the Rolling Stones, so did THEY become un-cool when I wasn't paying attention? I'd still like to own a restored 57' Chevy one day, but is that considered un-cool, like an old man's car? I never wore "high-water" pants either, so are they now in fashion?

What makes me so old-fashioned, un-cool, and old that some people don't think it's appropriate that I bartend in a casino any longer? I still have all my hair, I don't smell like rotten leather, and the last time I bartended I could run circles around the younger barbacks. So why is being 55 years old considered to be taboo and un-hip in Las Vegas now? I always got along with younger people, and much older people as well.

Liz Benston, the reporter who wrote that Las Vegas Sun article about me, also wrote a couple of other interesting articles that touches on age discrimination in the casino industry:

Not hip enough?
http://www.lasvegassun.com/news/2007/mar/23/not-hip-enough/

$25,000 check cuts no ice with bartender
http://www.lasvegassun.com/news/2008/aug/27/25000-check-cuts-no-ice-bartender/

Youth, good looks a gold mine on LV Strip
http://www.lasvegassun.com/news/2006/may/19/youth-good-looks-a-gold-mine-on-lv-strip/

Do people like Greg Abate of the ABC Bartending School in Las Vegas think 21-year-olds should fill all the upper-management level positions as well? Should they rule the world? Or does he think it's OK to be an elderly CEO (or an old fuddy-duddy manager like himself), but it's not OK to be an older bartender? How about an old president? (Oops! I'm older than Obama too! OMG!!!)

It's ludicrous to think I'm too old to bartend behind a casino bar simply because I passed the 50 yard line.

Since losing my job two years ago I've lost almost everything I've owned. I still have my TV, stereo, computer, and guitar. While most people might say my best years are behind me, and I'm not as fast or as handsome as I once was, maybe some folks might think that the best is yet to come.  (You can tell that this has really hit a nerve with me.)

I never thought of myself as ever being "ultra-cool", those were the people that set the standards and led the pack in coolness. They started all the cool trends, they were the "trend-setters". Me, I always thought of myself as being only "semi-cool", just a regular guy with my own quirks who sometimes drove cool motorcycles and cool cars and listened to cool music and dated cool girls and hung out with cool friends...

...but sometimes I also said and did some really dumb, stupid, and very un-cool things too.

Oh, and I almost forgot, I once had this really cool 8-track tape deck installed in my bitchingly very cool 1969 Triumph TR-6, but I'm sure it wasn't nearly as cool as the CD players are today.

And I'm also very sure that in a very short 30 years from now most of the very cool 21-year-olds today will be told they're old and obsolete "has-beens" too, just like me. The difference being, they may very well be, but I'm still cool. And I'll still be cool when I'm 80 years old too (you just won't notice as much, but on inside, I'll know).

Nobody likes the aches and pains that naturally comes with getting older, or the receding hairlines, wrinkles, or bags either. But I especially hate being disrespected, called names, and insulted as though just the act of aging alone were some kind of an affront on a decent and civilized society. To those critics I would say, you are very UN-COOL, and so therefore, you can go "F" yourself.

True coolness isn't based on how old someone is, it's a state of mind. Take by dad for instance. He was one of the most coolest guys I've ever known. It's just that when I was much younger, I hadn't realize it at the time. Sometimes you have to grow up first to know what truely cool really is.